Delaware School Funding 101
Introduction
Delaware has been working to update its school funding system for several years. In 2018, Delawareans for Educational Opportunity and NAACP filed a lawsuit over deficiencies in the educational resources provided to low-income students, students with disabilities, and students who are multilingual learners. The lawsuit sought to have those students provided with the systematic educational resources required by the Delaware Constitution. A settlement was reached (PDF opens in new tab) in October of 2020.
Since then, an independent assessment (Site opens in new tab) of Delaware’s funding system, as required by the settlement, was completed in 2023. Later in 2024, the state established the Public Education Funding Commission (PEFC) to review and act upon the recommendations uncovered in the assessment.
As of late 2025, PEFC is weighing a new “hybrid” funding model, with legislation and implementation awaiting in 2026 and beyond.
How Does Delaware Fund Schools?
Delaware schools spend about $21K per student annually and most of those funds come from the state.


Sources: DE Report Card (Site opens in new tab), Delaware 2024 Per Pupil Expenditure (PDF opens in new tab)
School districts and charter schools get their funding from a mix of state, local, and federal money. This site focuses on the state portion, which in Delaware makes up the largest share of school funding (about 61 percent).
Click here to learn more about the local portion and referendum reform.
The state portion pays for teacher and school personnel salaries, energy costs, among other costs. Local taxes make up the local source of school funding and typically fund capital projects, general operations, charter payments, and more.
The current system
Produces wide disparities in student performance
Percent of All Students Scoring At or Above Proficiency by Race, 2025
| Assessment | All Students^ | Asian American^ | Black or African American^ | Hispanic or Latino^ | Multi-Racial^ | Native American^ | Native Hawaiian or Pacific Islander^ | White or Caucasian^ |
|---|---|---|---|---|---|---|---|---|
| Smarter English Language Arts | 41% | 73% | 28% | 30% | 42% | 33% | 48% | 54% |
| Smarter Math | 34% | 73% | 18% | 23% | 34% | 23% | 39% | 47% |
| SAT English Language Arts | 47% | 80% | 32% | 32% | 52% | 43% | 38% | 63% |
| SAT Math | 18% | 60% | 8% | 10% | 20% | - | - | 27% |
Percent of All Students Scoring At or Above Proficiency by Disability, Low-Income, and Multilingual Learner Status, 2025
| Assessment | All Students^ | Students with Disabilities^ | Low-Income Students^ | Multilingual Learner Students^ | Male^ | Female^ |
|---|---|---|---|---|---|---|
| Smarter English Language Arts | 41% | 12% | 24% | 15% | 36% | 32% |
| Smarter Math | 34% | 10% | 17% | 15% | 37% | 45% |
| SAT English Language Arts | 47% | 10% | 29% | 5% | 46% | 49% |
| SAT Math | 18% | 2% | 6% | 2% | 19% | 18% |
Delaware's current system is one of the most restrictive in the country with only 8% percent of state funding considered flexible. This means that school leaders have very little room to make decisions on how to spend dollars to meet their students' and schools' specific needs.
Based on analysis of Delaware state budget.
Resource-based
Delaware is only one of 6 states that uses a resource-based formula. Delaware’s resource-based formula looks like this:
Students always generate the same fraction of a “unit” regardless of a student's need. Since units fund positions filled by individuals, each unit has a value on the state salary schedule based on years of experience and educational background. Therefore, the value of each student's funding will vary depending on the education and experience level of teachers in their district.
More simply put: Districts that attract and retain experienced, more highly paid teachers—which are often more affluent districts—get more money from the state.
Source: The Education Trust
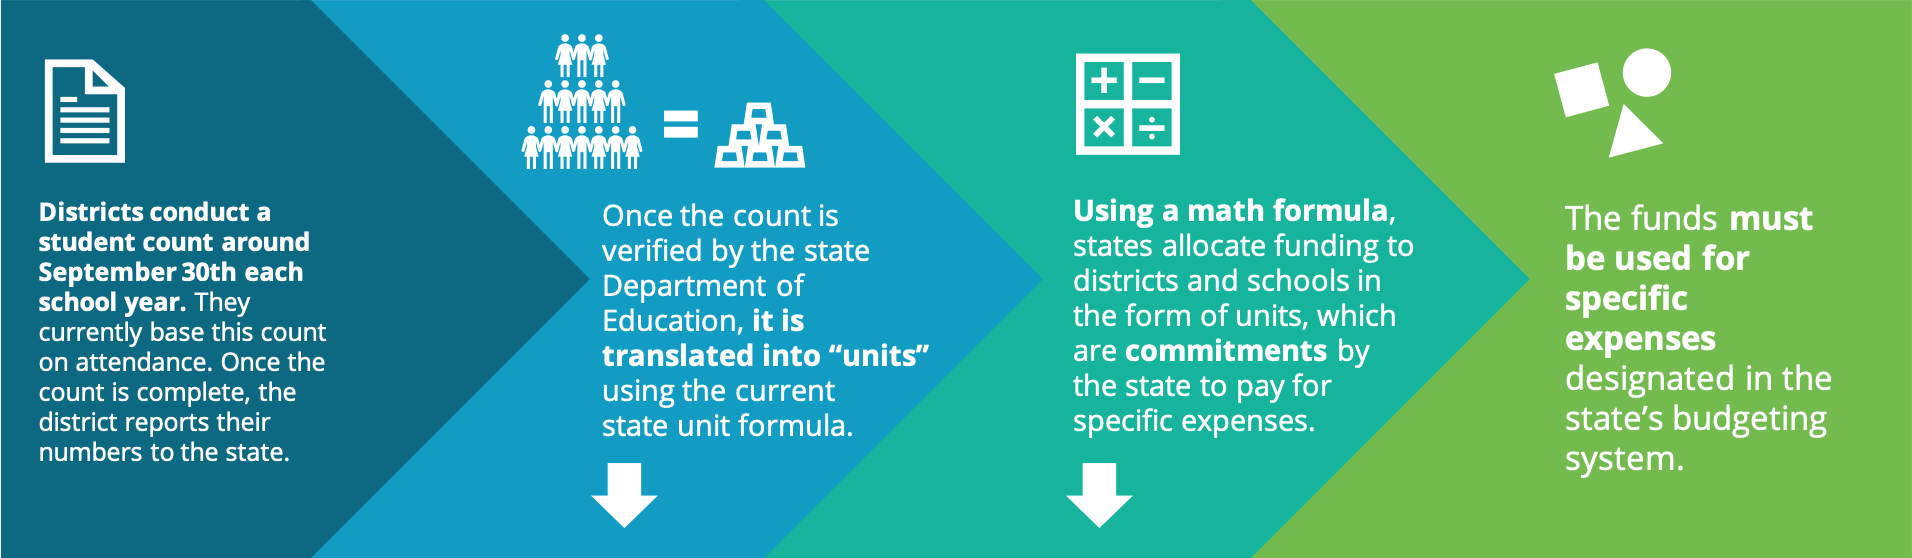
Money is allocated mostly for specific staff positions (teacher units) based on student-to-staff ratios, e.g.:
- K-3 Regular Education: 16.2 students = 1 unit
- K-3 Basic Special Education: 8.4 students = 1 unit
- 4-12 Regular Education: 20 students = 1 unit
- 4-12 Basic Special Education: 8.4 students = 1 unit
- PreK-12 Intensive Special Education: 6 students = 1 unit
- PreK-12 Complex Special Education: 2.6 students = 1 unit
Unit is composed of 3 divisions:
- Division I (teachers) (~86%) value based on teacher's position on state salary schedule
- Division II (All Other Costs and Energy) (~5%)
- Division III (Equalization (~9%)
Opportunity Funding is separate and layers on top of the core allocation.
Resource-based
STRENGTHS & WEAKNESSES
Provides district with a predictable level of resources
Policymakers see what their education dollars are funding
Allow the state to control most of the education policy expenditure decisions
Student needs are not considered
Confusing and opaque, makes public accountability difficult
Do not allow districts to easily move funding around based on the district or students' needs
Requires the state to constantly adjust for non-teacher related costs of education (supplies, technology, testing)
Inflexible, difficult to adapt, and time consuming
Reflect a rigid and outdated education setting, in which classrooms consists of a single teacher, a certain number of students, and a set of needed materials
Does not adapt well to alternative structures of teaching like blended learning or co-teaching
Allocation of resource units depends on teachers' education and experience level
Leads to over-reliance of novice teachers in highneeds schools, and fewer actual dollars in these schools
 Counting Students
How do states count students? (Site opens in new tab)
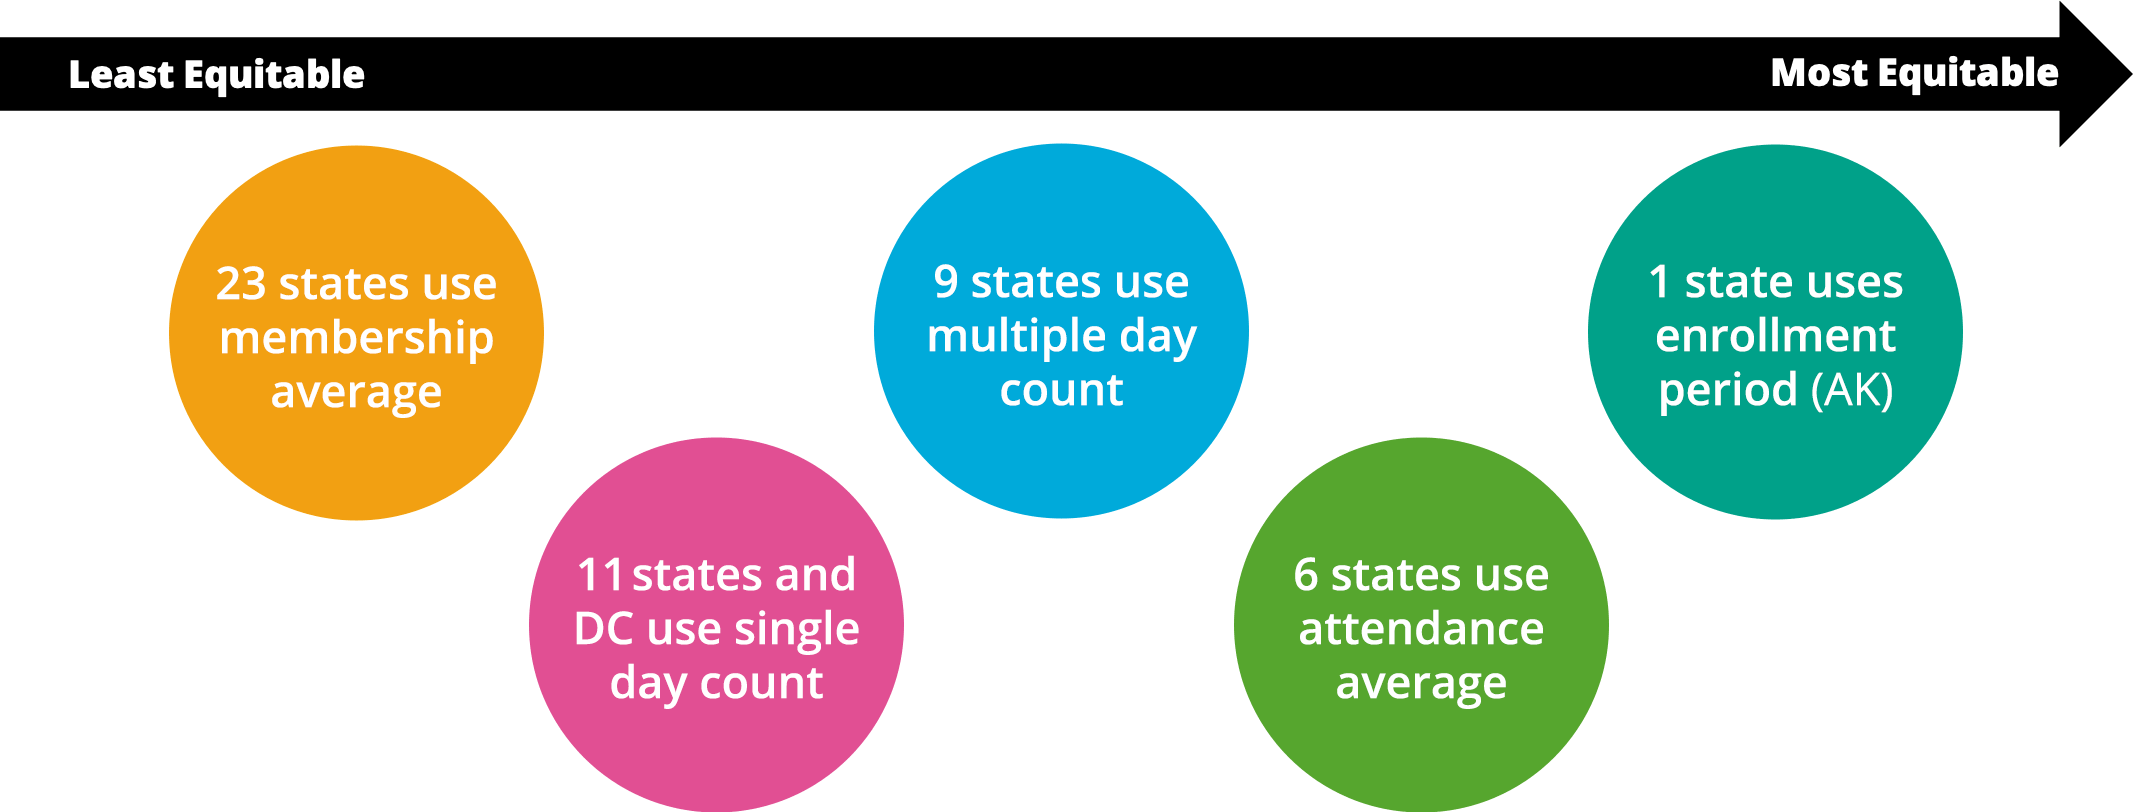
Source: Adapted from Education Commission of the States
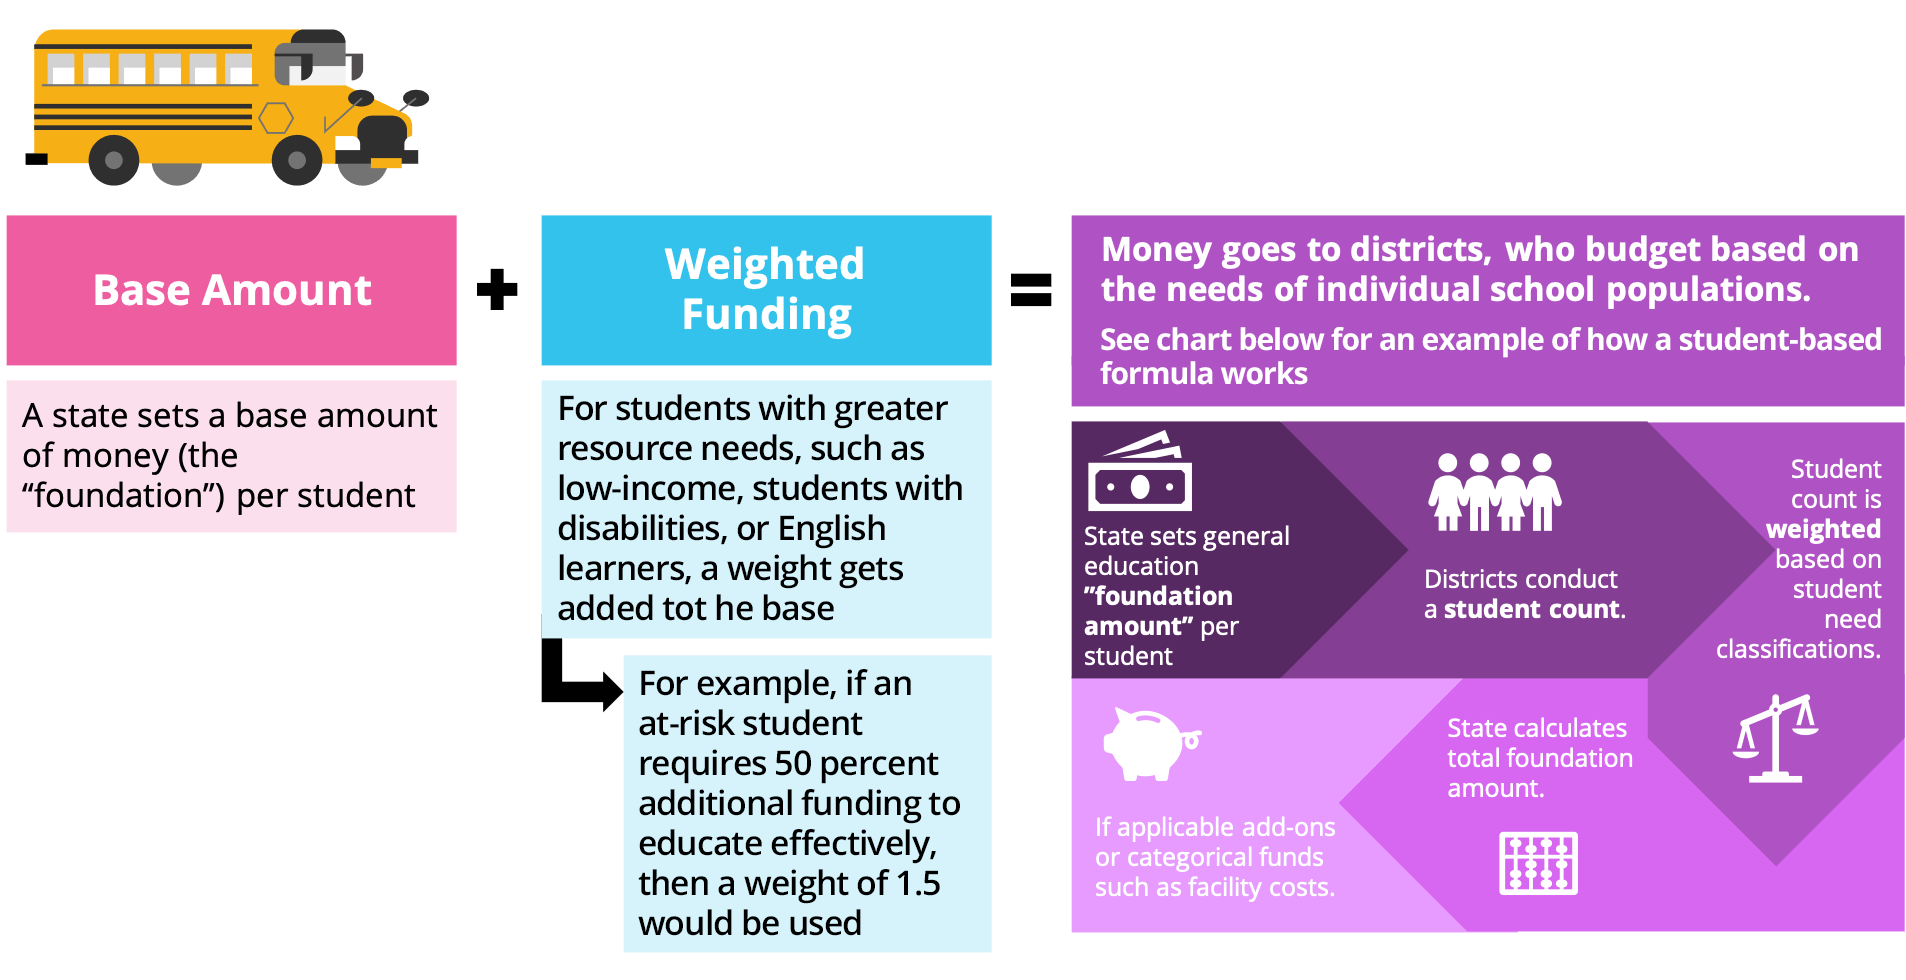
Student-based (or Foundation)
Experts Say
Delaware's school funding system is inequitable.

Delaware's Funding System
"Requires a one-size-fits-all approach to allocating the vast majority of resources between and within districts instead of recognizing that some schools serve students with greater needs and should have additional resources."

Ary Amerikaner Vice President for P12 Policy, Practice, and Research, The Education Trust
"By any of the available measures, Delaware is not ensuring that students in schools with high shares of low-income students have the same access to high-quality teachers as their peers in more advantaged schools."

Dr. Jesse Rothstein University of California, Berkeley
"By failing to make sufficient investments in effective educational interventions Delaware is trading off short-run budget “savings” for much larger long-run economic burdens."

Clive Belfield Queens College Department of Economics
"In Delaware, the high percentages of [low achievement among] disadvantaged students should be seen as the educational emergency that it is: substantial proportions of Delaware students are not on track."

Andrew Ho Harvard University
State Funding Formulas
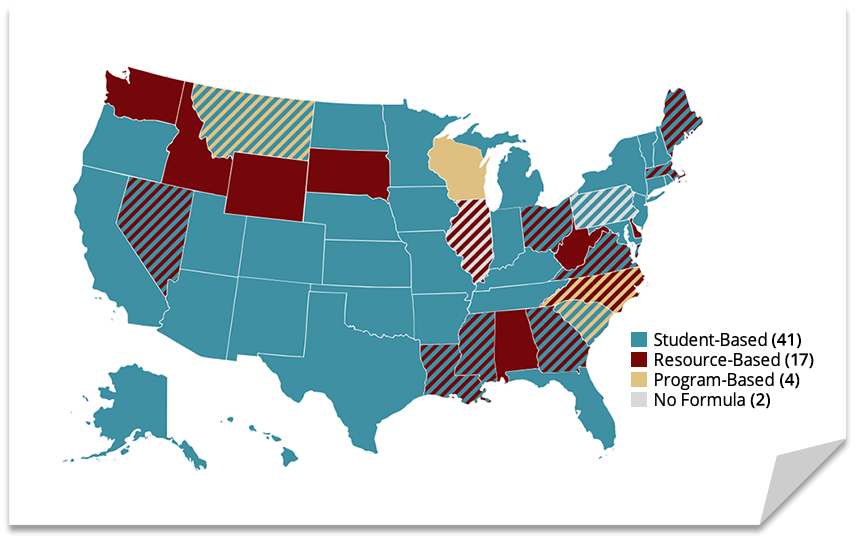
Did you know? Different states take different approaches to funding their public schools. Each state has its own unique twists, but they generally fund schools based on two basic formulas: student-based or resource-based.
Source: EdBuild
Student-based (or Foundation)
Students and their needs at the center of the funding calculation
Maximizes equity
Easy to establish
Easily adjusted to meet a state's/district's educational needs and economic circumstances
Provides districts with greater autonomy and flexibility
Built for transparency — simple to understand how much money a student should be getting and to hold the state and districts accountable
Regional Funding
Delaware’s Opportunity Funding is only three percent of total education funding*
*may not be comparable to the percentage weight other state use
Funding Model

DE
Resource Based

NJ
Student based
$12,177
Base in FY 22

MD
Student based
$7,991
Base in FY 22

PA
Hybrid
only 13% of funds¹
No consistent base
Students with Disabilities
DE
Multiple staff ratios by category
NJ
Census Based Allocation
assume 15.4% of students would be eligible for services
Additional $18,612
MD
Single student weight
86% current or
$6,872
153% by 2030
PA
Multiple student weights by category
Between
55% to
646%
Students from Low-Income Backgrounds
DE
Flat dollar amount
NJ
Multiple weights based on concentration
Between
47% and 57%
MD
Single student weight
91% or
$7,271
PA
Multiple weights based on concentration
Between
30% and 90%
Multilingual Learners Funding
DE
Flat dollar amount
NJ
50% weight
$6,088.5
MD
100% weight
$7,991
PA
20 teachers per
1,000 MLLs
MD, PA, NJ all allocate a base per-pupil amount and add an additional percentage to that base in the form of a weight.
Delaware does not have a base per-pupil amount, so the weighted funding in other states has been expressed as a dollar amount to allow for comparison.
¹distributed through weighted formula, resource based formula

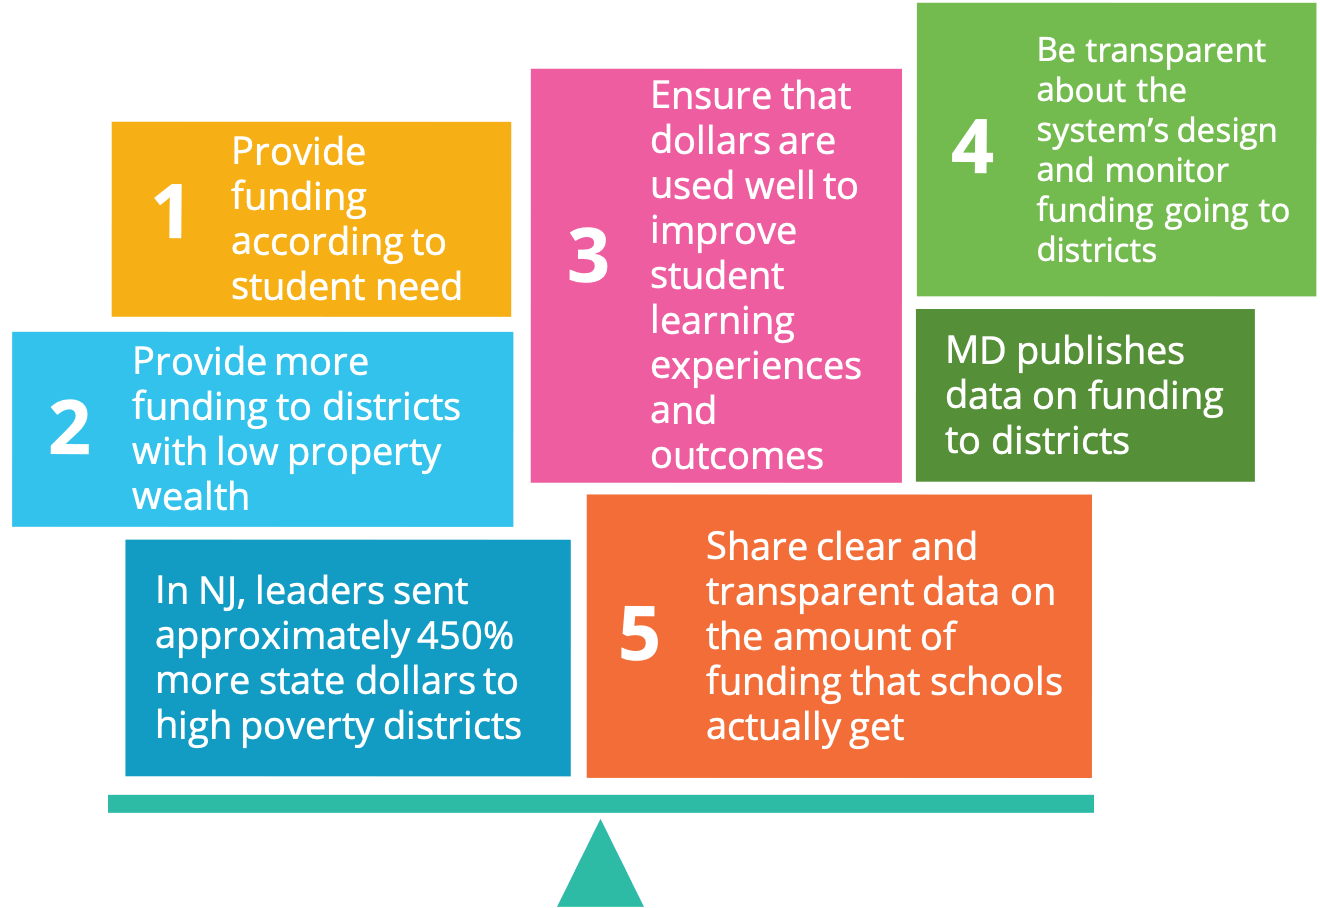
Transparency and Accountability: Building for the Long Haul
It has taken Delaware nearly 80 years to open up this policy discussion. We shouldn't wait another century to take another look. We should build in transparency and accountability so that we can ensure our tax dollars are going to where they can be used best.
States need accountability measures to ensure funding is spent on resources and evidence-based supports that will close opportunity and achievement gaps for high needs students.
Why We Need to Change How We Fund Our Schools
Inflexible
While our world has changed quite a bit since the 1940s, Delaware's system locks educators into a cookie-cutter approach designed 80 years ago. It only allows for about 8% discretion for school leadership teams to respond to the everchanging needs of their communities.
Antiquated
Delaware's funding system has been around since World War II, a legacy of a time that was largely blind to issues of equity.
Inequitable
While there have been tweaks to the system along the way, it still largely assumes that all students are the same, despite decades of study and mountains of evidence to the contrary. Many students, including those from low-income families, or those with special needs, require additional resources to thrive in school.
Now is the time to take a holistic look at our funding system...

Implementation: We Can Do This
Every other state in the nation has modernized its system multiple times during the last eight decades. Some stakeholders have raised concerns about modernizing the funding system because it would be too unpredictable. The reality, as all other states have proven many times over, if adequate time is given to planning and transition, predictability isn’t a problem.
Transitions are possible. Schools can be brought in gradually through a multi-year phased in approach with adequate planning, notification, and communication. The transition for each school should take multiple years – allowing for sufficient planning and course corrections.
Costs include additional resources for students with needs, professional development for school and district leaders, potentially new accounting or technology systems, and technical expertise and capacity to support the transition process.